
Metabolomics
The Swedish NMR Centre is Centre is a national facility for metabolomics by NMR within the framework of SwedNMR and SciLifeLab.
Metabolomics – what is it?
Metabolomics research focuses on the analysis of small (<1.5kDa) molecules (metabolites) and their temporal and systematic variation altered by internal or external factors. In short, metabolomics is the identification and quantification of all metabolites in a biological sample detected by the present technology at a given condition and/or point in time. For NMR, this encompasses about 50 to a few hundred metabolites depending on the matrix analyzed. At the Swedish NMR Centre we have experience of a number of different biological matrices for metabolomics analysis, the majority being human origin (serum/plasma, urine, feces and extracts of different tissues such as muscle, liver and brain) but also including samples from model organisms such as mouse, rat, yeast, insects, macroalgae, mammalian cell cultures and bacteria.
The two dominant analytical techniques in metabolomics is mass spectrometry and NMR. The former is available to researchers in Sweden primarily through the Swedish Metabolomics Centre, which also has a node in Gothenburg in the Chalmers Mass Spectrometry Infrastructure. The Swedish NMR Centre in Gothenburg and Umeå offers NMR-based metabolomics, with access to both expertise in sample collection for solid-state NMR (e.g. biopsies) and for bioliquids, and also support for statistical analysis of collected data is available.

Metabolomics workflow: case study
1. Preanalytical phase
In metabolomics, the preanalytical phase of planning, collecting samples and sample preparation is of utmost importance in order to avoid unwanted confounding variance in the resulting spectroscopic data. For a successful project, it is necessary to consider even minute practical considerations:
- Is there a sampling SOP in place, e.g. stating what sampling tube, timing, centrifugation speed, temperature storage, sample transport method etc. should be used?
- If the sampling occurs at different sites, by different people, has any effort in unfying the SOP been done?
A central mantra in planning for a metabolomics project should be 'same, same, same' to ensure that, even though maybe a suboptimal sampling scheme was used, at least a comparison between samples that have had a similar history before ending up in the NMR spectrometer will be sensible.
Case study
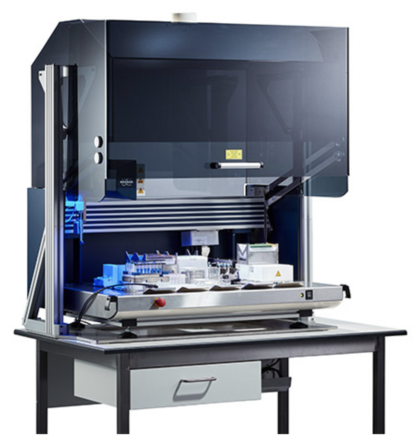
The project is about the effect of gastric bypass surgery and related medication on diabetic kidney disease (DKD). The samples were urine that were prepared according to the Bruker IVDr SOP for human urine samples, i.e. dilution 9:1 sample:buffer before transfer to SampleJet NMR tube racks. The sample preparation was done with a Bruker SamplePro liquid handling robot (nickname "Sebulba") to minimize human handling error. All sample were kept cool throughout the preparation process and also in the sample changer before going into the spectrometer. Acquisition order was randomized to minimize batch effects.
Case study publication
Recent SNC-supported metabolomics publications
- Kelpsiene et al. 2023 Environmental Science: Nano (External link)
- Hasselbalch et al. 2023 Metabolomics (External link)
- Nilsson et al. 2022 Frontiers in Neuroscience (External link)
- Martin et al. 2022 Clinical Sciences (External link)
- Martin et al. 2022 Metabolites (External link)
- Martin et al. 2022 Frontiers in Endocrinology (External link)
- Klinke et al. 2022 Cellular and Molecular Life Sciences (External link)
- Veskovski et al. 2021 Experimental Hematology (External link)
Frequently asked questions: preanalytical phase

2. NMR data acquisition
Data acquisition relies heavily on automation, from sample handling to actual spectrometer operation, to be able to run 24/7 without human intervention. Spectrometers at SNC used for metabolomics are equipped with cooled SampleJets and can hold up to 480 short NMR samples. In practice, sample preparation and submission for data acquisition is done in a pace suited to match the spectrometer throughput.
For the vast majority of projects, acquisition means running different 1-dimensional 1H-NMR experiments on each sample. Typically 1D-NOESY (metabolites and proteins/high molecular weight complexes detected), 1D-CPMG (only metabolites detected) and 1D diffusion-edited (only high molecular weight components detected) experiments are acquired for each sample depending on the particular matrix.

Frequently asked questions: data acquision
3. Spectral processing
The acquired data is transformed from time to frequency domain via a Fourier transform often followed by baseline correction and smoothing. In the spectra different metabolites have characteristic peak patterns with intensities proportional to their corresponding concentrations, in theory making both annotations and concentration quantification straight forward. Often peaks from different metabolites overlap however, which in combination with slight peak position changes between spectra due to pH and ionic strength differences make this more difficult requiring either deconvolution to separate signals from different metabolites, or a less ambitious approach dividing the spectrum into buckets accepting that some measured values are sums of concentrations from different metabolites.

Manual spectral deconvolution
An example of manual spectral deconvolution and metabolite identification in a serum sample, using software and spectral reference databases. It's clear that overlapping signals can be a significant problem in complex biofluids, e.g. the three signal clusters for glycerol (in green) overlapping with glucose and other metabolite signals.

Automated spectral deconvolution
An example of automated spectral deconvolution using the TopSpin function mldcon (Bruker BioSpin) on cerebrospinal fluid.
4. Data analysis and metabolite identification
Typically, first the overall quality and general trends in the data are determined. This is often assessed with unsupervised multivariate analysis, like principal component analysis (PCA).
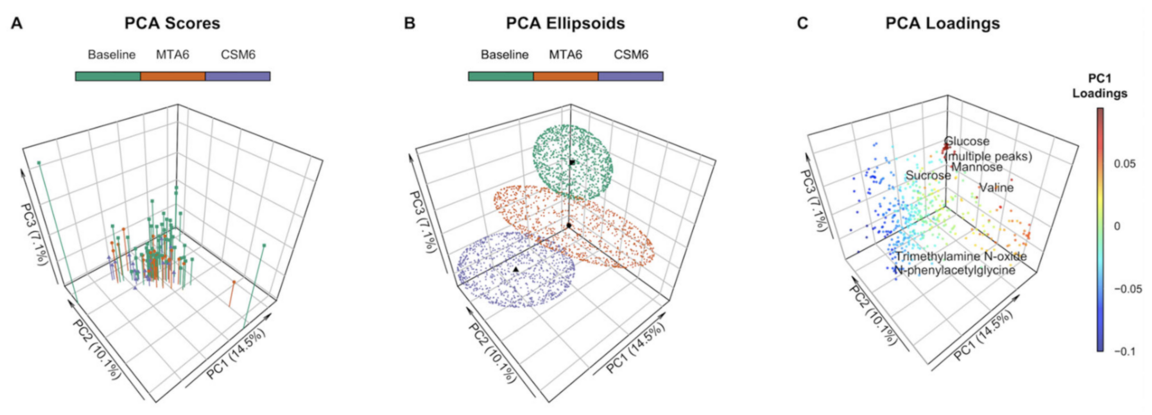
Case study: principal component analysis
Already from a PCA (A, B) score plot it is evident that medical therapy alone (MTA) and combined gastric bypass plus medical therapy (CSM) at six months differ from each other and baseline. (C) From the corresponding loading plot some molecules important for the separation can be found.
Second, any associations between the data and independent variables are often described using supervised multivariate analysis like Projections to latent structures (PLS), Orthogonal Projections to latent structures (OPLS), or Random Forest.
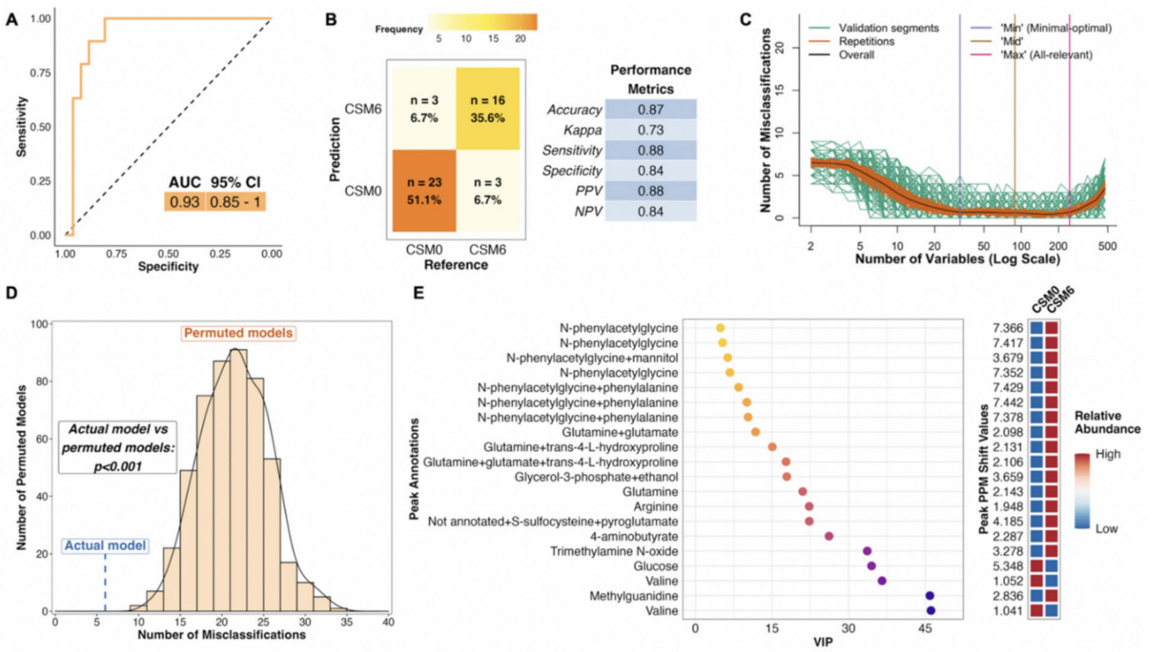
Case study: supervised modeling
A PLS model of the baseline vs CSM month 6 samples showing a convincing (A) receiver operating characteristic curve, (B) confusion matrix, and (D) permutation model all supporting that there is a difference between the groups. (C) Using between minimal-optimal and all relevant number of variables give the best separation with optimal validation performance. (E) The most important variables (metabolites) for the model and if they are higher or lower in concentrations six months after surgery.
Third, traditional univariate analysis looking for individual metabolite associations to independent variables is done.
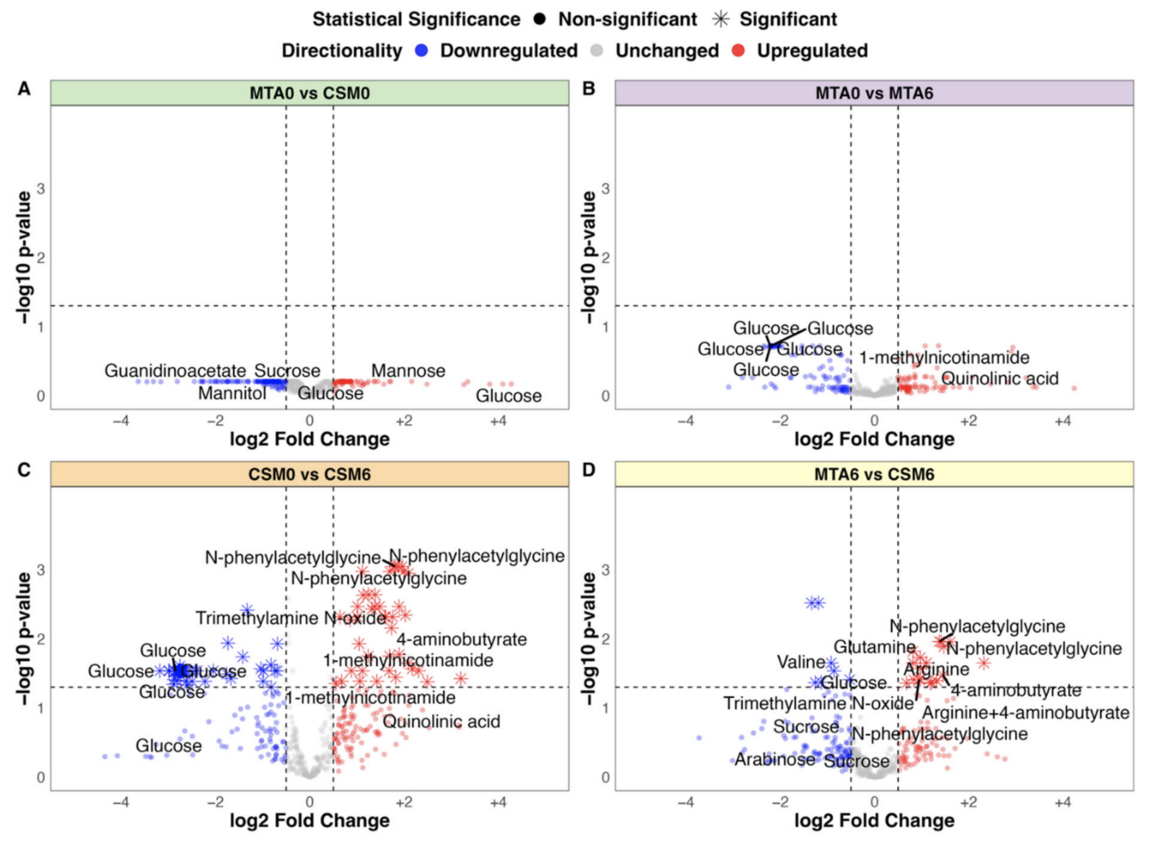
Case study: univariate statistics
(A-D) Univariate comparisons between baseline, and MTA and CSM at six months. (C) Univariate analysis to a large extent often gives similar results as multivariate analysis.
Frequently asked questions: data analysis
5. Biological interpretation
The biological interpretation of the metabolomics output and analysis is generally left to the client but SNC is happy to refer to the relevant bioinformatic competence at NBIS.
Case study
NMR urine metabolomics implicate gastric bypass‐induced urinary metabolomic changes in host–microbial co‐metabolism, aromatic amino acid metabolism, and BCAA catabolism in the enhanced improvements in blood pressure, glycaemia, dyslipidaemia, and albuminuria observed in patients with obesity, type 2 diabetes, and early chronic kidney disease treated with medical therapy.
Relevant links
Metabolomics instrumentation
The instrumentation at the site in Gothenburg includes cooled sample changers hooked up to 600MHz and 800 MHz spectrometers. The 600MHz spectrometer is set up as a Bruker In Vitro Diagnostics for research (IVDr) platform (more information from Bruker) making results obtained in Gothenburg directly comparable to results obtained elsewhere in the world, allowing for big collaborations as well as longitudinal studies where samples are recorded at different times.
The workflow guarantess minimal degradation and high quality of samples using highly automated procedures with an unbroken cold chain, generating NMR data of high international standard which is essential for downstream biological interpretation of metabolomics data.
When running plasma/serum samples under IVDr SOP, every sample is analyzed for spectral quality as well as sample quality. Apart from checking that the NMR-spectroscopy is performed according to the IVDr specifications, the identity and integrity of the actual sample is also assessed. Preanalytical mishandling of the sample or even contamination from the actual blood draw can be detected and that can in turn be taken into consideration when analyzing the metabolite and lipoprotein profiling data.


Access to infrastructure
To apply for access or for questions on eligibility, costs etc., click the relevant link to the right.