Sea water systems
For both deep and surface water entering the Kristineberg Main Building, salinity and temperature are continuously measured. It can be seen on the Water and weather data web page. Compiled measurement results from 2007-2013 and 2016-2018 are shown in diagrams below.
Deep water
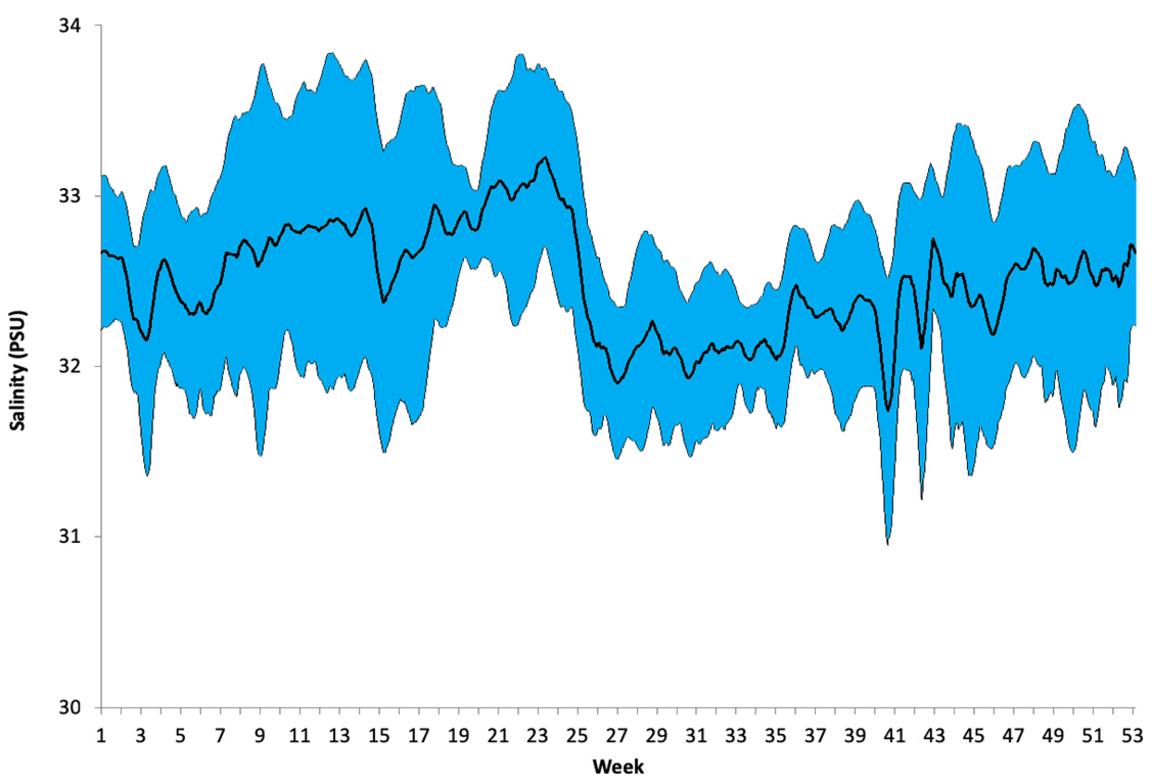
Salinity of deep water in the laboratories, mean (bold line) with 95% confidence interval (blue). Highest and lowest measured values are 35.2 PSU and 26.5 PSU, respectively.
Photo: Martin Larsvik
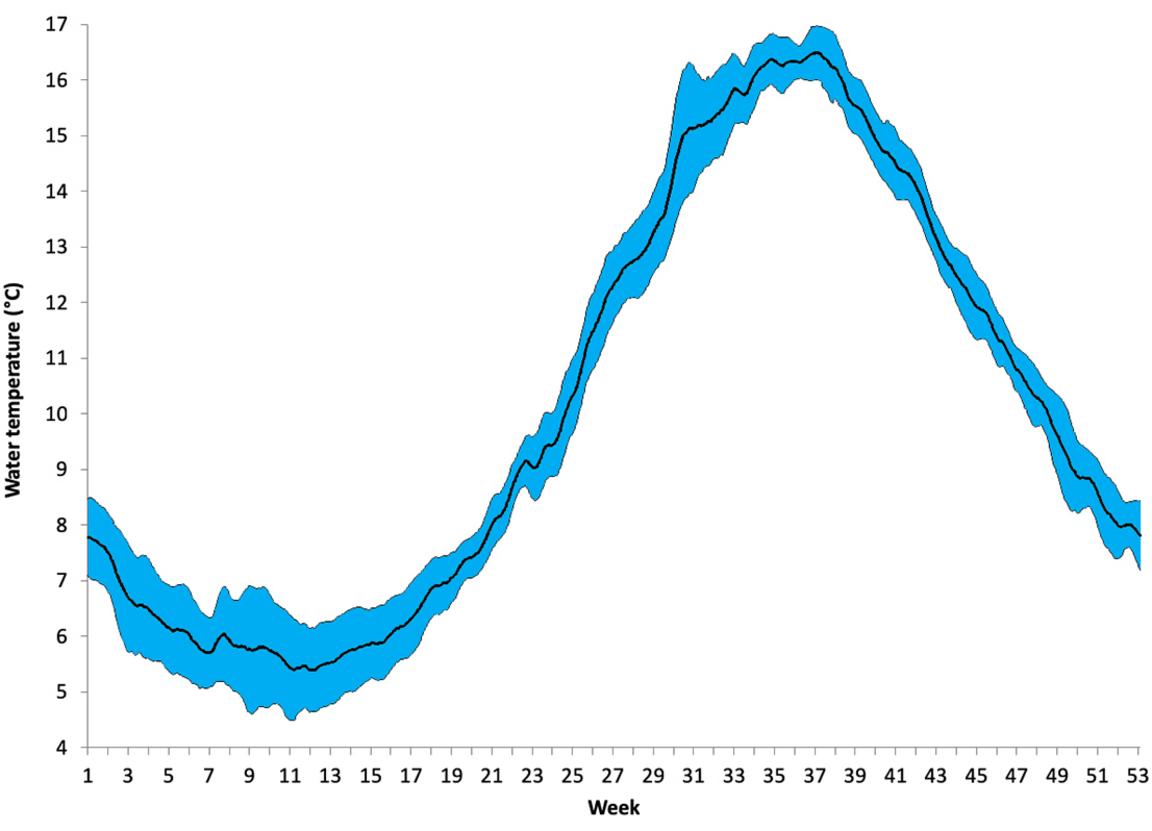
Temperature of deep water in the laboratories, mean (bold line) with 95% confidence interval (blue). Highest and lowest measured values are 21.0 °C and 1.4 °C, respectively.
Photo: Martin Larsvik
Surface water
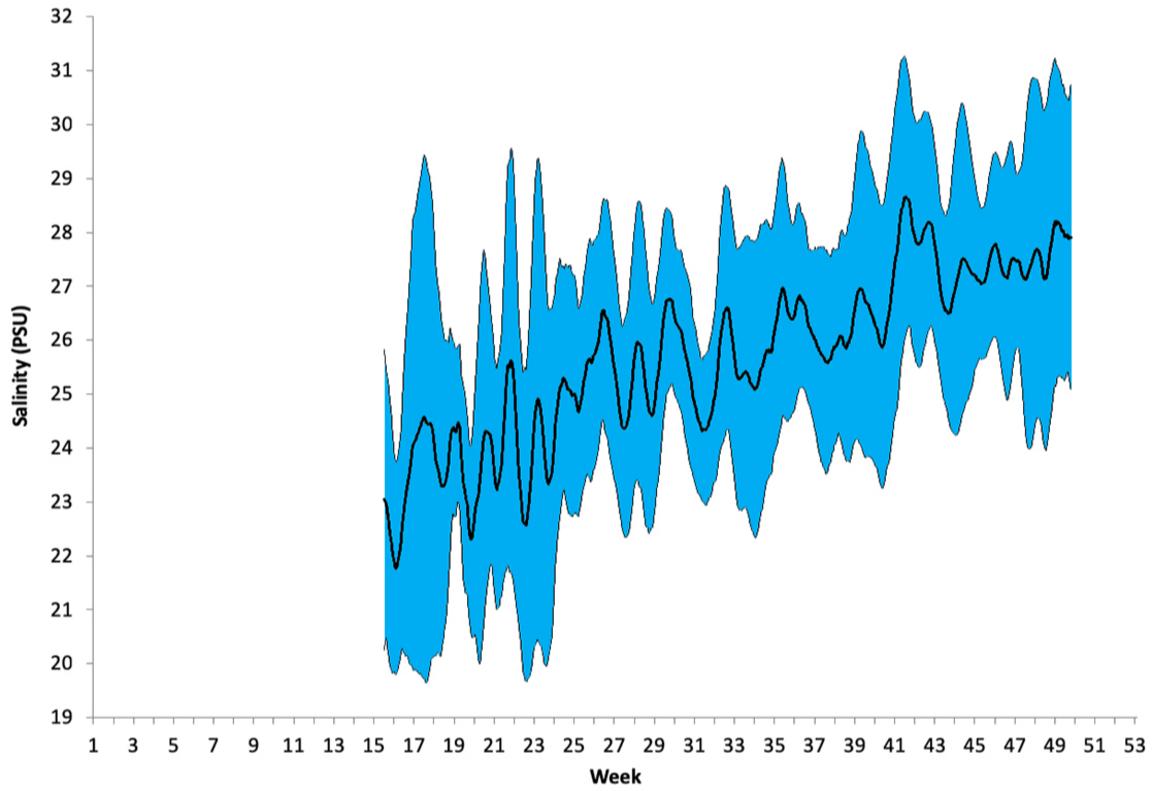
Salinity of surface water in the laboratories, mean (bold line) with 95% confidence interval (blue). Highest and lowest measured values are 33.5 PSU and 15.6 PSU, respectively.
Photo: Martin Larsvik
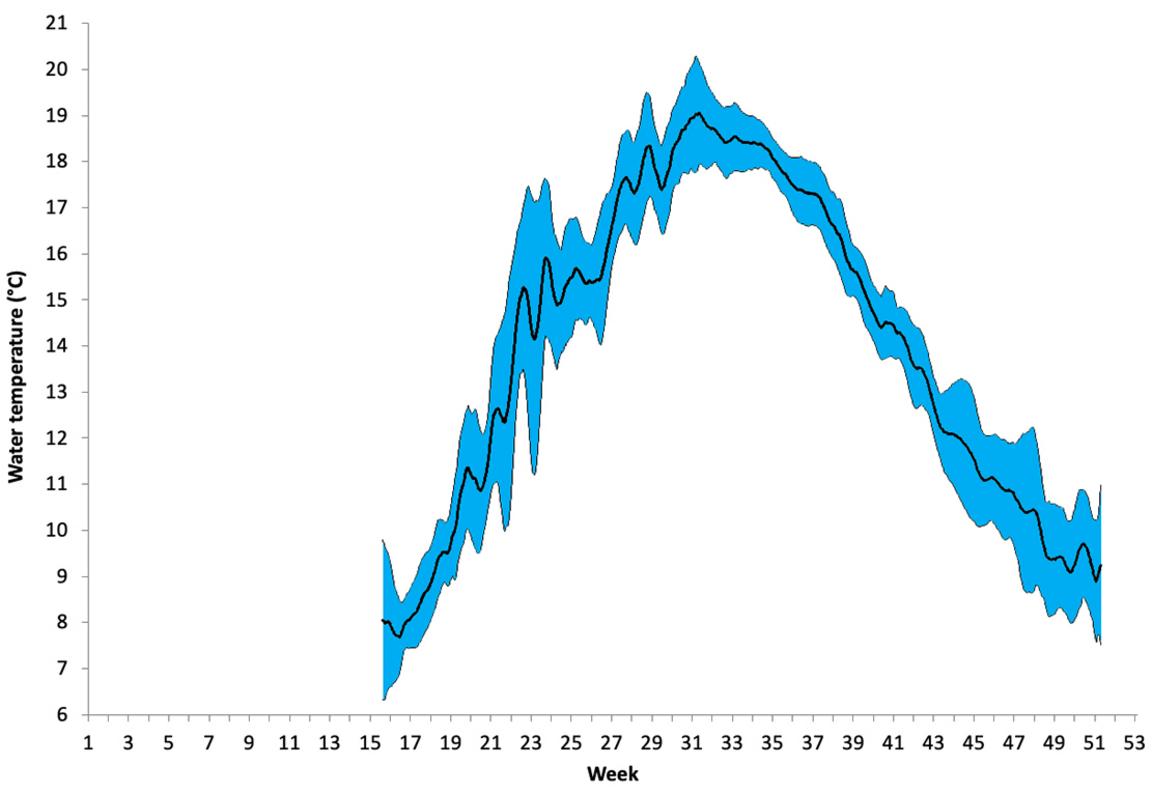
Temperature of surface water in the laboratories, mean (bold line) with 95% confidence interval (blue). Highest and lowest measured values are 22.1 °C and 4.7 °C, respectively.
Photo: Martin Larsvik